Description
The narrow bar running the full width of the GUI at the bottom of the screen (shown inside a red rectangle in the image below) is referred to as the Status Bar. This area is almost entirely devoted to only providing various types of information or feedback, with one interactive exception: the Dual Progress Bar.
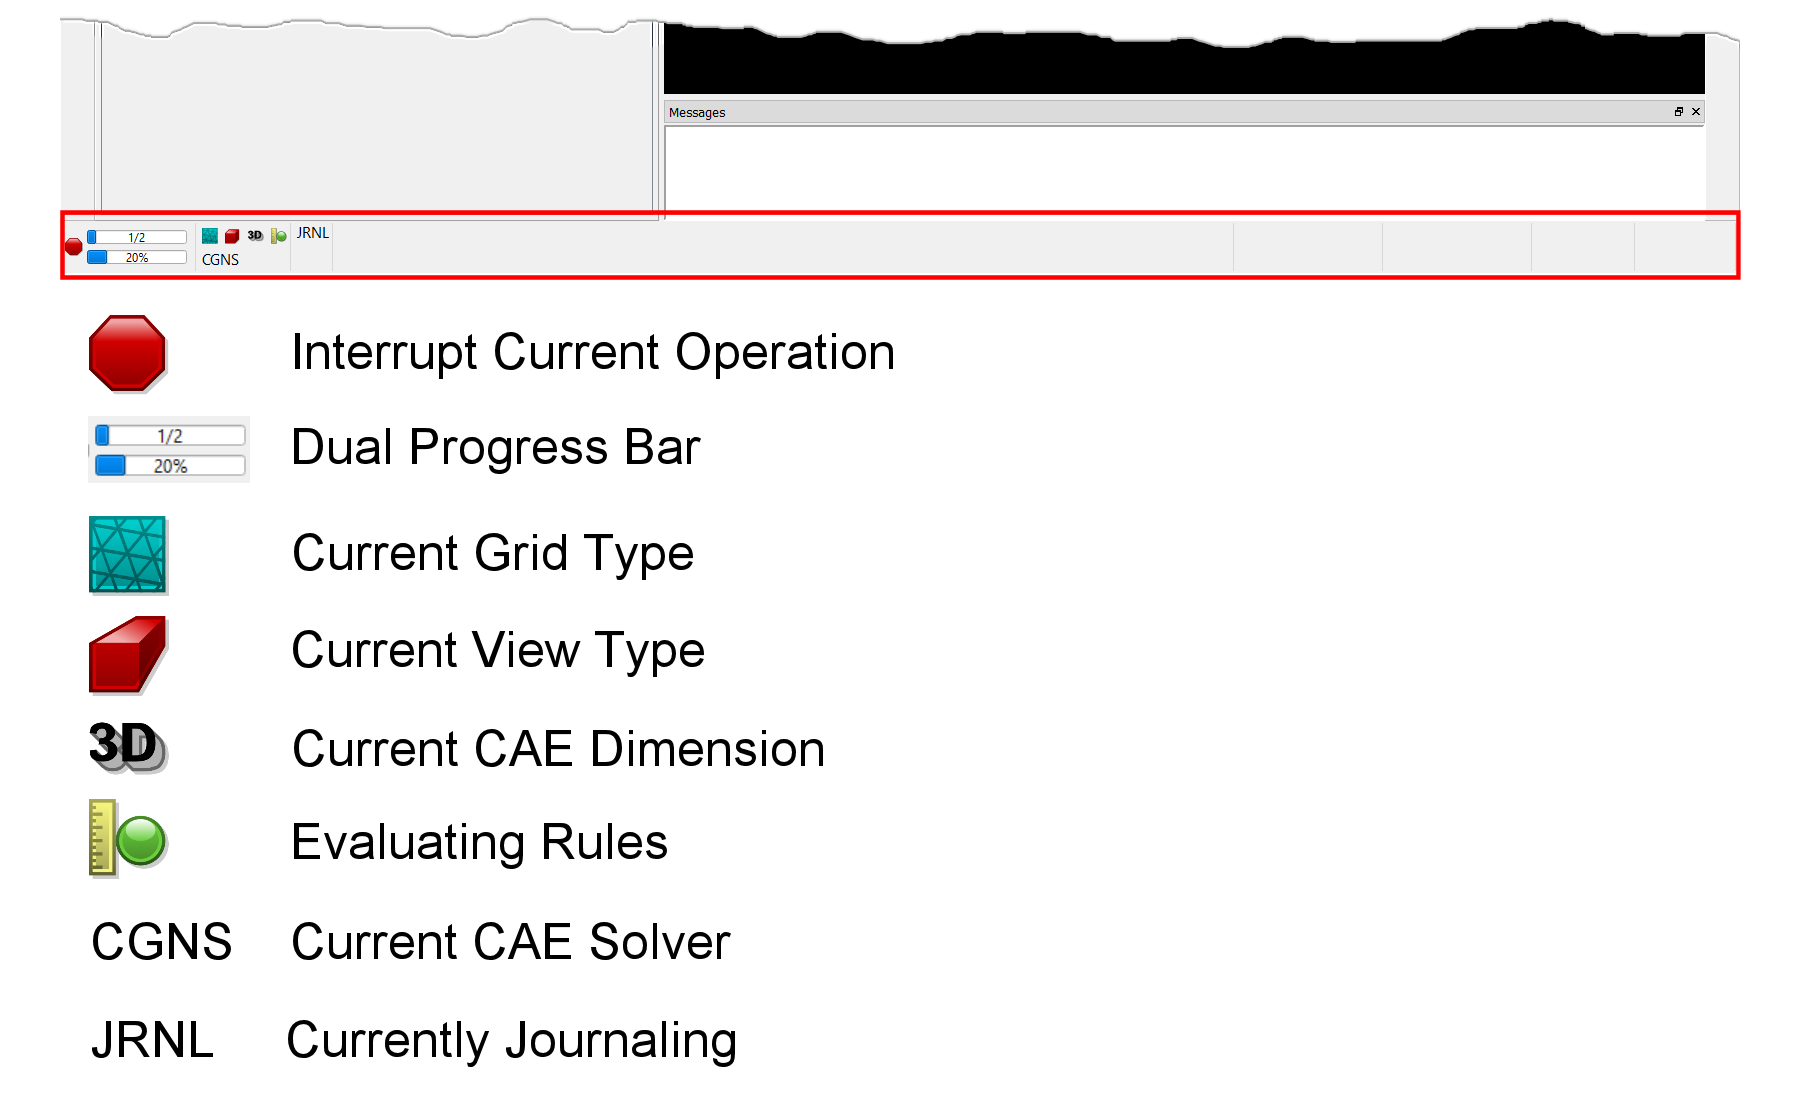
When an extended duration command process is under way, the dual level progress bar at the far left of the Status Bar becomes active indicating which and how many stages in the top progress bar and the status or progress of the current stage in the bottom progress bar. At the left of the progress bar, an Interrupt Current Operation icon also becomes active during an extended command process. This icon is an activated button that allows you to abort from the process that is under way. Note that some command processes may have a duration which cannot be predetermined. In these cases, the bottom bar strobes to indicate progress.
Note: Fidelity Pointwise uses a separate thread to handle the GUI. This allows the Messages window and Status Bar to be updated and the Display window to remain responsive while commands are being processed. You can learn more about multi-threading within Fidelity Pointwise by going to the Special Topics page on Parallelism.
To the immediate right of the dual progress bar, there is a set of icons indicating the state of a number of global settings: grid type, view type, CAE dimension, condition of rules if one or more exists, and selected CAE solver. To the right of the state icons there is a section where the text JRNL is displayed when journaling is turned on.
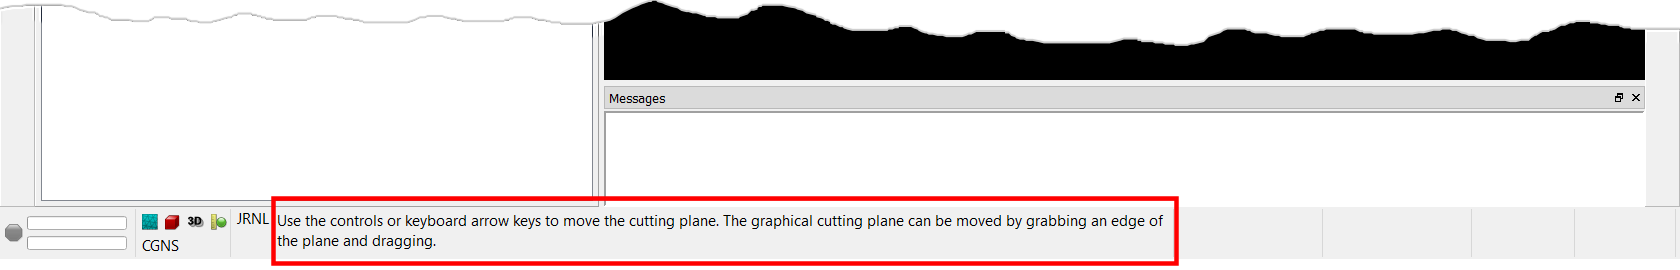
The large field at the center of the Status Bar is devoted to guidance text. Additional context sensitive information will be provided here when useful to help "guide" you through certain commands or operations.
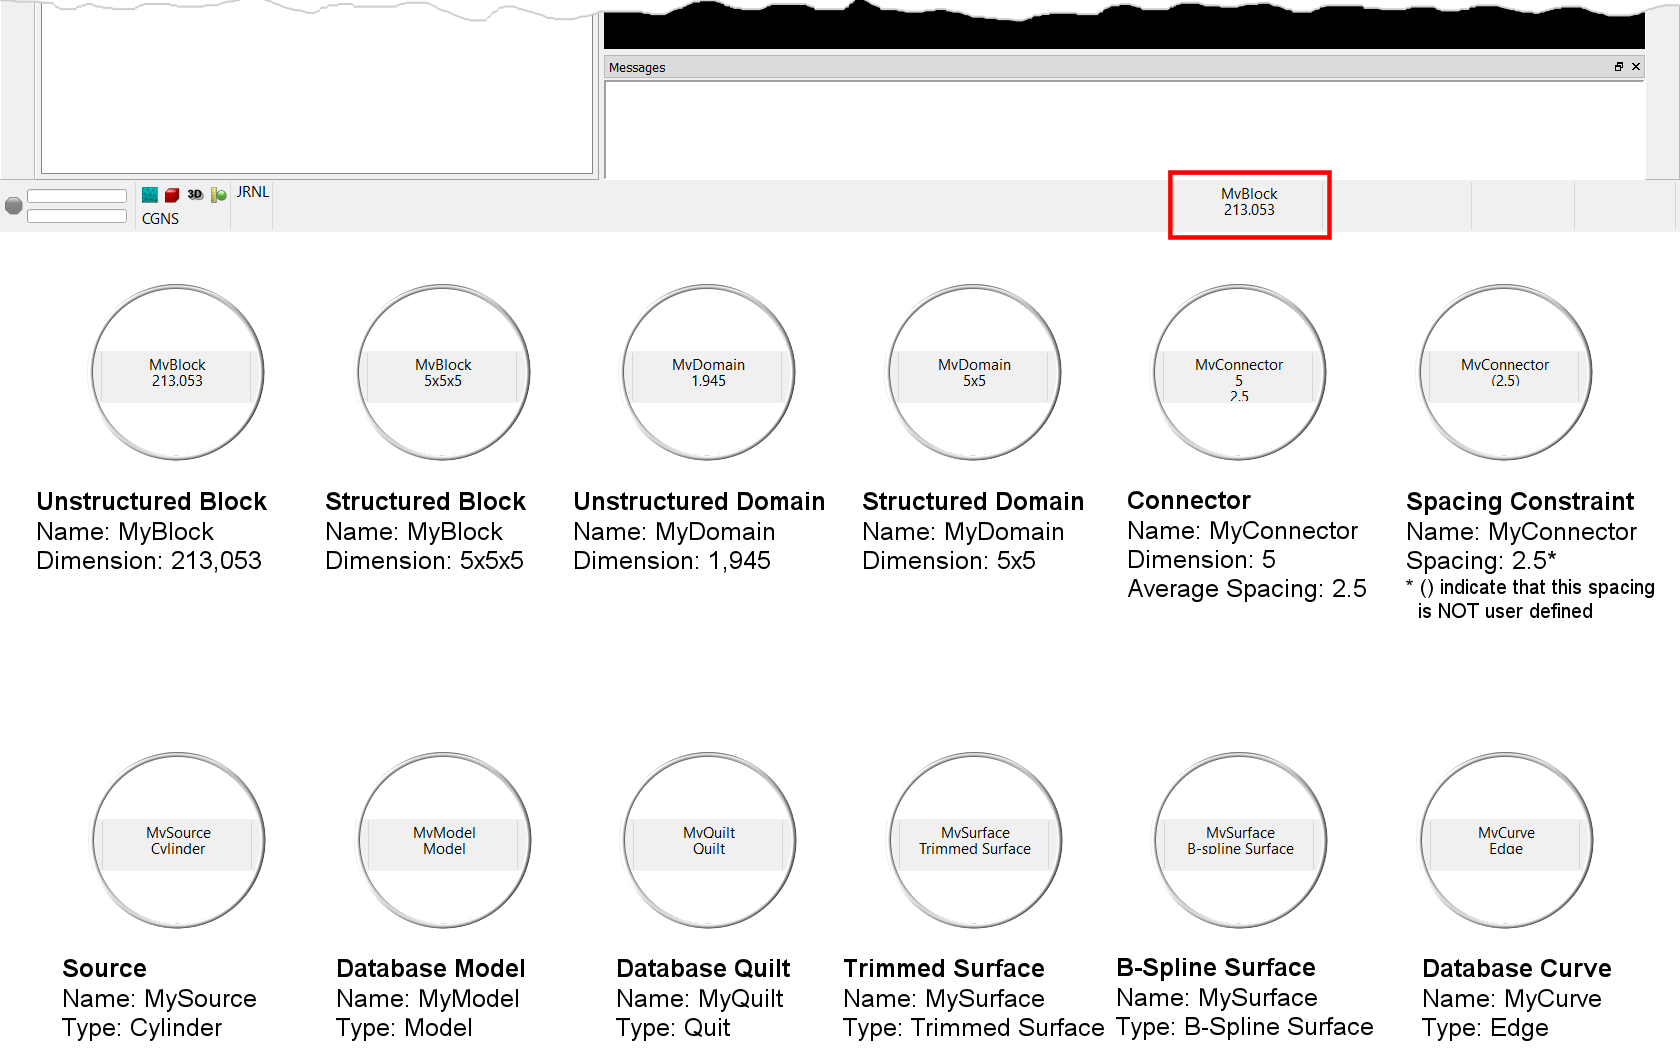
To the right of the guidance text field, there is a section of the Status Bar referred to as the probe area which provides information about any entity currently highlighted in the Display window. The same information is displayed in the probe area when mousing over entities in the List panel. This area will generally provide two pieces of information about an entity: its name and a commonly used technical item. Bold text will be used if an entity is selected or if mousing over a selected entity. Italic text will be used if an entity being highlighted by the mouse is in an inactive framework. Selection of entities in inactive frameworks is typically not allowed. However, a few specialized commands such as Create, Automatic Volume Mesh, Create, Build Refinement, and Create, Cut Planes, do allow selection of entities from an inactive framework.
Tip: When creating points for curves, particularly on database entities, you can always refer to the coordinates listed in the Status Bar to confirm the location of a potential pick point.
The figure below shows examples of the information displayed in the probe area of the Status Bar when entities of different types are highlighted. For example, if you highlight a connector, the probe area will show its name, dimension, and average spacing. On the other hand, if you highlight a connector's spacing constraint, the connectors' name and the spacing constraint value are shown. In this case, note that spacing values shown in parentheses are unspecified or free; they are actual values resulting from the subconnector distribution function and any constraint applied at the opposite end.
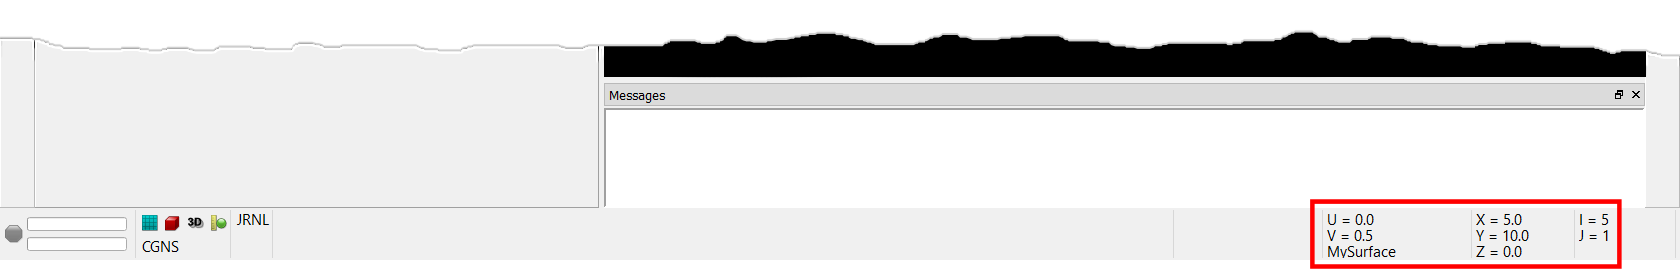
The three remaining fields on the right side of the Status Bar are used to list UV, XYZ and IJK coordinates of points as appropriate for certain commands. Additionally, the corresponding database entity name is shown with listed UV coordinates. For instance, in the example shown in the figure below, a split location is being selected in the Display window for a database constrained structured domain. Therefore all three fields are active in this case.