Description
The Database Deviation and Relative Database Deviation examine metrics are available when at least one domain is selected for Examine. These metrics are intended to estimate the deviation between the linear cell and the curved high-order (H-O) cell projected onto the underlying database.
Tip: Database Deviation and Relative Database Deviation are computed using the stencil for a 4th order (Q4) surface cell. This provides a reasonable estimate of the deviation observed during H-O elevation. Minimizing deviation typically results in less required curving and smoothing during the H-O export process.
Database Deviation is computed by sampling the cell using the 4th order stencil (shown in the images below) and projecting the H-O nodes onto the underlying database. The final Database Deviation is then calculated by taking the maximum projection distance (or deviation) of all the H-O nodes. Relative Database Deviation is computed in the same way, except that it scaled by the maximum edge length of the linear cell:
Ddatabase = max [di]
Drelative = max [di] / max [Lj]
where:
di = the deviation between the linear and projected position at H-O
node i
lj = the length of cell edge j
Note: Domains that are not database constrained (i.e. free) have a Database Deviation and Relative Database Deviation of 0.
The value of Database Deviation and Relative Database Deviation varies from 0 (good) to ∞ (bad). Large values indicate that the linear mesh may need additional refinement to adequately resolve the underlying database curvature during H-O elevation. Domains that are not database constrained (i.e. free) have a deviation of 0.
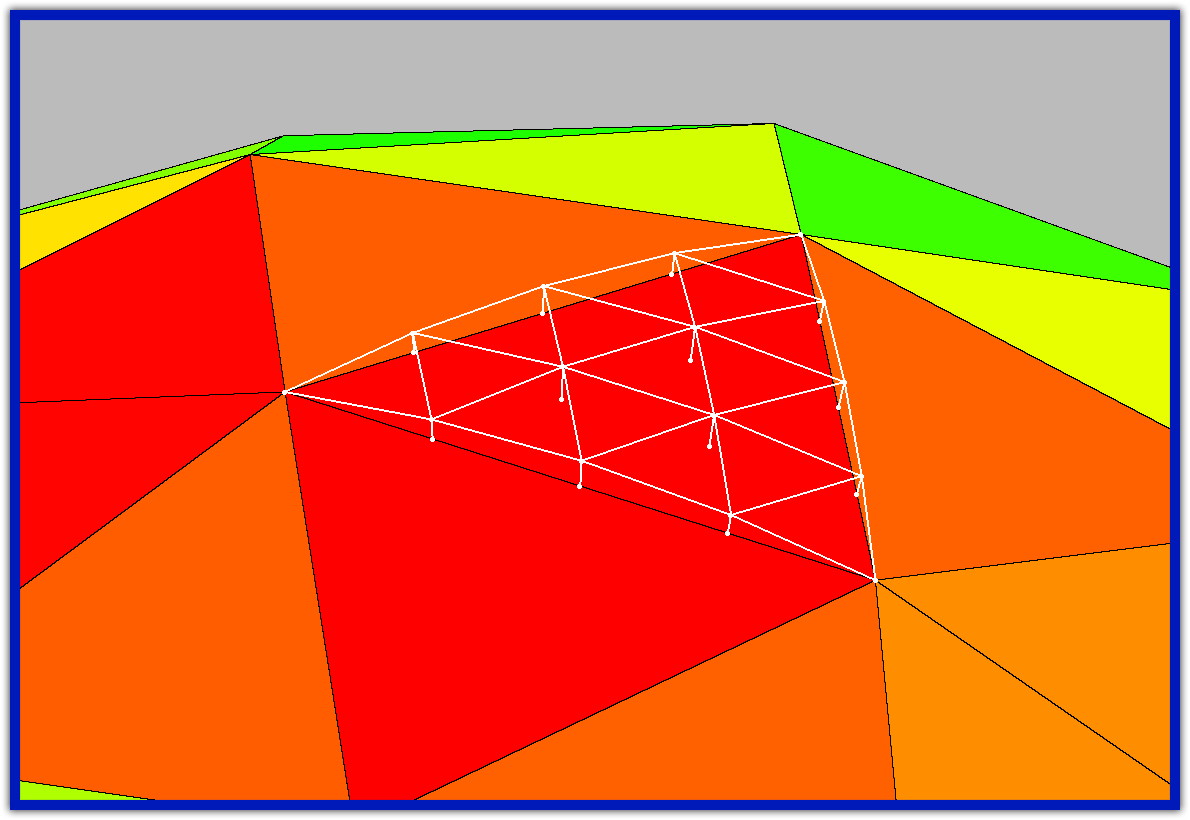

For these functions, the probe renders both the linear and projected H-O node locations for the 4th order cell. Although only the maximum distance is reported for these metrics, you can use the Point Probe functionality to measure the displacement for any of the H-O points rendered.
Tip: When examining Database Deviation and Relative Database Deviation, use the probe functionality to visualize the curved 4th order surface cell (triangle or quadrilateral) and the point probe functionality to measure the displacements of the H-O nodes. This gives you a good idea of how much curving will be required during H-O export.