Description
While in the Examine task, Fidelity Pointwise has the ability to use static controls to show and hide cells, edges, vertices, and overset data (i.e. fringes, donors, orphans, and holes) in a variety of ways (refer to the Examine Tab, the Cuts Tab and Overset Tab sections for more information).
Note: The Overset tab is only available when an overset assembler has been selected in the Grid, Overset command panel.
In this section we discuss how examine Filters can be defined in a flexible manner to provide a finer level of control over what objects are shown while inside the Examine task. Note that these filters can only be created within the Examine task for volumetric cells (refer to the Data Hierarchy section for more information). At this time, examine Filters cannot be created for surface (domain) or line (connectors) grid entities.
An examine Filter is defined by an element type (Grid or Overset) and a hierarchical set of filtering elements which consist of Boolean Decision nodes and Condition nodes. Each examine Filter can be assigned a unique user-defined name; it can also be turned on or off as desired.
A Decision node consist of one of the following Boolean logical operations: Match All (AND), Match Any (OR), or Match None (NOT). On the other hand, a Condition node, is formed by three elements: an Attribute, a Comparison operator, and a Value. The available Attribute options will depend on the Type of filter being defined. A Grid filter can only have conditions based on volumetric cell metrics; on the other hand, an Overset filter can only have conditions based on overset assembly data (when available).
When no filters are defined and enabled (turned on), the Examine task works as usual; the static controls in the Examine, Cuts, and Overset tabs determine which objects are visible. On the other hand, when one or more examine Filters are defined and enabled, the displayed cells are a combination of those that meet both the static display controls and which pass the enabled filters. In other words, all the static control cells are displayed in addition to those passing the enabled filters.
The Filters panel shown below is used to define the desired examine Filters. The commands available in this panel are explained in detailed below.
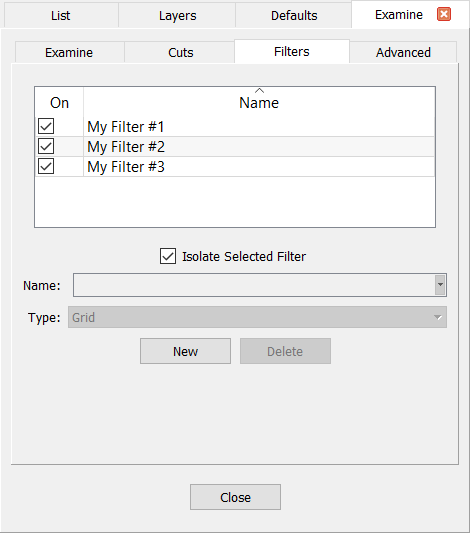
The table at the top of the Filters panel shows all the filters you have created. The checkboxes in the On column allow you to turn the appropriate filters on/off. The fields in the Name column display the unique name of each filter.
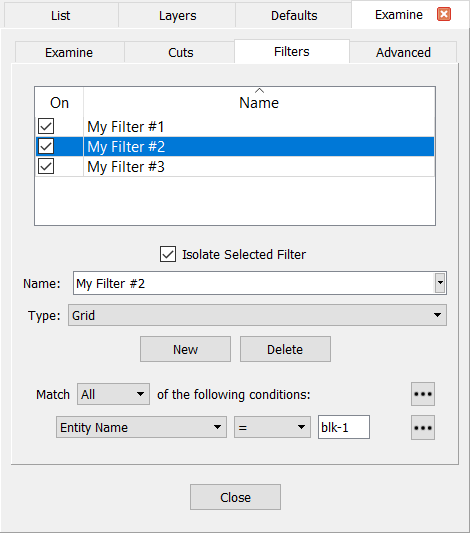
The table also provides a mechanism for selecting an existing filter to operate on via the commands found in the following areas of the panel. Note that only a single filter can be selected at a time. Once a filter is selected, the fields in the panel will be populated with the filter's attributes. Also, the Display window will be updated automatically to show the volumetric cells or overset data collected by the selected filter. In the figures above, three filters have been defined and the second one is currently selected (right).
Immediately below the table you will find the Isolate Selected Filter checkbox. This command is very useful to quickly visualize the effect of each filter one at a time. When checked on, it forces the display of only the currently selected filters on the Display window regardless of which filter may or may not be turned on for display.
The Name filed allows editing the name of the selected filter. Note that the names of the filters must be unique.
The Type pull-down provides a list of types available for a filter: Grid and Overset.
Below the Type selector, you will find the commands to create a New filter or to Delete the one currently selected.
When a new filter is created or an existent filter is selected, a whole host of options is displayed immediately below the New and Delete commands (compare the left and right figures above). If a new filter is being created, these options will be populated with default values. If an existent filter is selected, the options will be populated with the attributes of the selected node. These selection-dependent options are displayed in the image below:
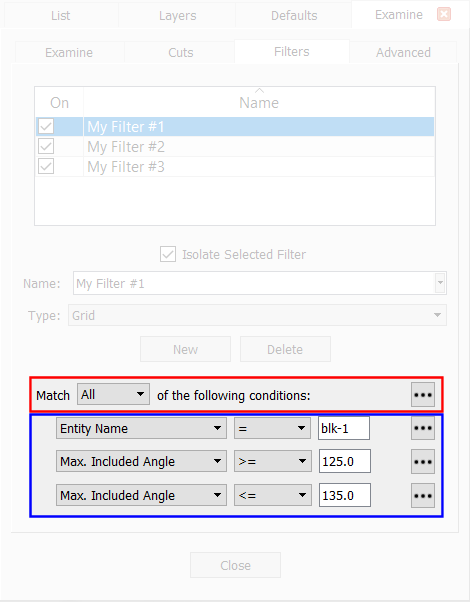
In the image above, the enhanced section of the Filters panel contains the definition of the first filter in the list (currently selected). This particular filter is comprised of one Decision node (within red box) and three Condition nodes (within the blue box).
Note: A red background in a Decision or Condition node indicates that the node in question is not properly defined. This could be because there is missing information (for example a Decision node does not have at least one Condition child node) or because there is information that has been entered incorrectly.
Decision node:
An example of a Decision node is shown in the figure above inside the red box. This portion of the image is reproduced below for clarity.
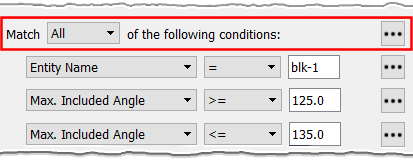
A Decision node consists of one logical Boolean operation indicating how its children (Option nodes) will be assessed. This Boolean operation is defined using the Match pull-down list which contains the following options: Match All (AND), Match Any (OR), and Match None (NOT).
Tip: The upper most Decision node in an examine filter's hierarchy cannot be deleted. This means that each examine filter must have at least one Decision node to be properly defined.
Clicking the ellipsis button (···) on the right side will open up the context menu shown in the image below:
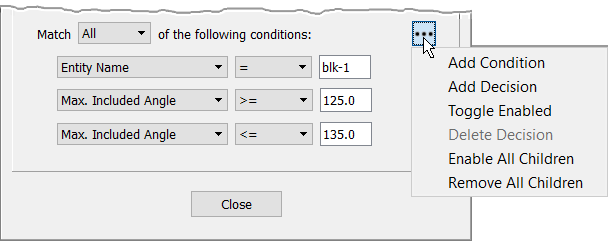
- Add Condition: Adds a Condition node at the end of the hierarchy tree. This new node is a child of the Decision node being defined.
- Add Decision: Adds a Decision node at the end of the hierarchy tree. This new node is a child of the Decision node being defined.
- Toggled Enabled: Toggles the current enabled/disabled state of the Decision node being defined.
- Delete Decision: Deletes this Decision node. Note that the upper most Decision node in the filter's hierarchy cannot be deleted.
- Enable All Children: Sets the state of all the nodes that are children of the Decision node being defined to enabled.
- Remove All Children: Removes all the nodes that are children of the Decision node being defined.
Note: Examine filters can be quickly turned on and off from a table located in the Filters frame inside the Examine tab.
Condition node:
An example with three Condition nodes is shown in the figure above inside the blue box. This portion of the image is reproduced below for clarity.
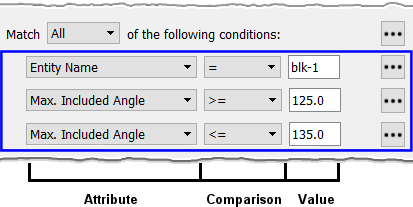
A Condition node is a leaf node containing no children. It is defined by an Attribute (left column in the image above), a Comparison operator (center column in the image above), and a Value (right column in the image above).
Attributes
The left column in the image above is where you will define the appropriate Attribute for the Condition node being defined. Note that the available Attributes will depend on the Type of filter being defined. A complete list is presented below.
| Attribute | Description | Grid Node | Overset Node |
|---|---|---|---|
|
* I, J and K have different usages for different block types:
• Structured: I, J, and K refer to the computational location.
|
|||
| X, Y, Z | Physical location of the cells' centroid | ✔ | ✔ |
| I, J, K * | Computational location of the cells | ✔ | ✔ |
| Point I, J, K * | Computational location of the points | ✔ | ✔ |
| Entity Name | Name of a grid entity | ✔ | ✔ |
| Current Function | The filter will use the current Examine metric function. | ✔ | |
| Other Function | The filter will use the selected examine metric function. A complete list of functions can be found in the Functions section. | ✔ | |
| Overset Element Type | Fringe, Donor, Orphan, or Donor Candidate | ✔ | |
| Donor Entity Name | Name of a donor block | ✔ | Donor Candidate Entity Name | Name of a donor candidate block | ✔ | Donor Volume Ratio | Refer to the Donor Volume Ratio section for further details. | ✔ | Donor Edge Length Ratio | Refer to the Donor Edge Length Ratio section for further details. | ✔ |
Comparison Operator
The center column in the image above is where you will define the Comparison operator for the Condition node being defined. The available Comparison operators will depend on the selected cell type and attribute.
For numeric-valued (float and integer) attributes:
| Operator | Options |
|---|---|
| Equality / Inequality | =, !=, >, >=, <, <= |
| Range | inside (i.e. in range), outside (i.e. out of range), largest, smallest |
For string-valued attributes:
| Operator | Options |
|---|---|
| Equality / Inequality | =, != |
| String Comparison | contains, regex, glob |
Note that all the string comparisons will be done case-sensitive.
Value
The right column in the image above is where you will define the Value for the Condition node being defined. The Value will be specified in a free-form text entry field.
If the inside or outside Comparison operators are used, mathematical range notation of the form "[x y]" or "(x y)" will be accepted to indicate inclusion/exclusion. For example, [0 1) means 0 ≤ value < 1.
If the largest or smallest Comparison operators are used, you will be able to enter either an integer number (e.g. 10) or a percentage (e.g. 10%) in the Value field. For example, specifying largest 10 will render in the Display window the data (cells or overset objects) whose metric value corresponds to one of the ten largest values calculated by the Examine task. Likewise, entering largest 10% will render in the Display window the data (cells or overset objects) whose metric value is in the top 10%.
Clicking the ellipsis button (···) on the right side will open up the context menu shown in the image below:
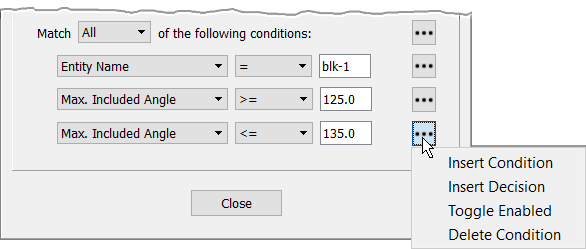
- Insert Condition: Inserts a new Condition node above the Condition node being defined.
- Insert Decision: Inserts a new Decision node above the Condition node being defined.
- Toggled Enabled: Toggles the current enabled/disabled state of the Condition node being defined.
- Delete Condition: Deletes the Condition node being defined.