Description
The Extrema frame presents the Minimum and Maximum diagnostic function values among all the entities currently selected for Examine. It also provides tools to easily identify the surface and volume cells corresponding to the displayed extrema values.
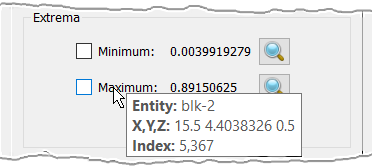
Hovering your mouse over the Minimum or Maximum labels will pop-up a tooltip (shown below) showing the Entity which contains the minimum or maximum extrema values, the X,Y,Z coordinates of the centroid of the appropriate extrema cell, and the cell's Index (unstructured) or IJK computational coordinate (structured).

A very powerful set of tools in the Extrema frame are the Minimum and Maximum checkboxes. They are used to have the cells
corresponding to the minimum and maximum extrema values of the current examine function rendered in the Display window in wireframe style with
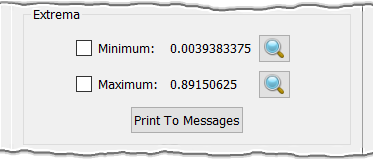
nodes. Additionally, you can zoom up on either cell automatically by using the appropriate Zoom command (![]() ). Note that when
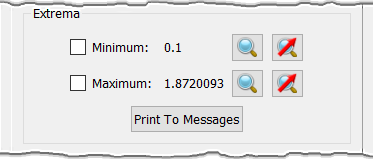
examining domains, there is an additional zoom tool for each extrema represented by a magnifying lens with a red arrow across it (
). Note that when
examining domains, there is an additional zoom tool for each extrema represented by a magnifying lens with a red arrow across it (![]() ). This is the Zoom and Align tool and it allows you to zoom in to the desired extrema
cell and align the view orientation with the normal to the cell in question. You can easily restore your previous view using the Recall Dynamic View
toolbar button (
). This is the Zoom and Align tool and it allows you to zoom in to the desired extrema
cell and align the view orientation with the normal to the cell in question. You can easily restore your previous view using the Recall Dynamic View
toolbar button (![]() ) or from View, Manage Views.
) or from View, Manage Views.
Tip: Hover your mouse over one of the displayed extrema values to automatically render the extrema cell in wireframe style in the Display window and zoom in to it. Hovering your mouse away from the extrema value will remove the extrema cell wireframe rendering and will restore your previous view.
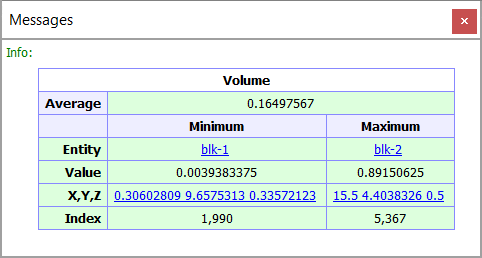
The last command in this frame is Print To Messages. This button will allow you to print out a wealth of extrema information to the Messages window as shown below.