Description
The Display frame (shown below) provides a number of visualization controls.
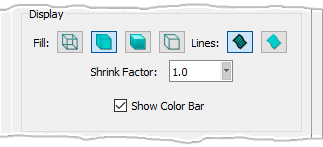
At top of the Display frame, there is a section devoted to controlling how examine objects will be rendered in the Display window. By default the Fill is set to Flat. Your choices for Fill include:
| Type | Description |
|---|---|
| Wireframe | Displays the examine visualization as colored grid lines. |
| Flat | Displays as colored filled cells without lighting effect. |
| Shaded | Displays as colored filled cells with light source. |
| Hidden Line | Displays as colored grid lines where only those gridlines closest to you are visible. All others as hidden and not rendered. |
Next in the Display frame is Lines. It is set to All lines by default. Your choices for Lines include:
| Type | Description |
|---|---|
| All Lines | Displays both boundary and interior lines. |
| No Lines | Displays no lines at all. |
In the Shrink Factor text field, you can input a value between 0 and 1 (default) to have cells shrunk about their centroids by the factor value. A factor of 0.5 would shrink all rendered cells by 50% about their centroids. This capability can make individual cells easier to distinguish from each other when a group is rendered together. Setting a Shrink Factor of 0 (zero) displays each cell as a fixed size node rendered at the cell centroid. This feature can be useful for finding very small cells and collapsed cells.
The Show Color Bar checkbox allows you to toggle the visibility of the color bar. Note that the color bar can be resized by clicking and dragging any edge of the color bar boundary and can also be repositioned by clicking and dragging the title area at the top of the bar.