Description
The tools contained in the Display frame allow you to visualize the surface curvature and size field that drive the automatic creation of the unstructured domains before the creation process actually starts. Furthermore, the table included in this frame presents information related to the most relevant quality metrics for the final surface mesh.
The first commands included in this frame are the Show Surface Curvature and Show Size Field commands, which allow you to inspect the surface curvature and size field, respectively. Since these are the driving forces behind the automatic creation of the unstructured domains, it is recommended to inspect both before running Create Surface Mesh.
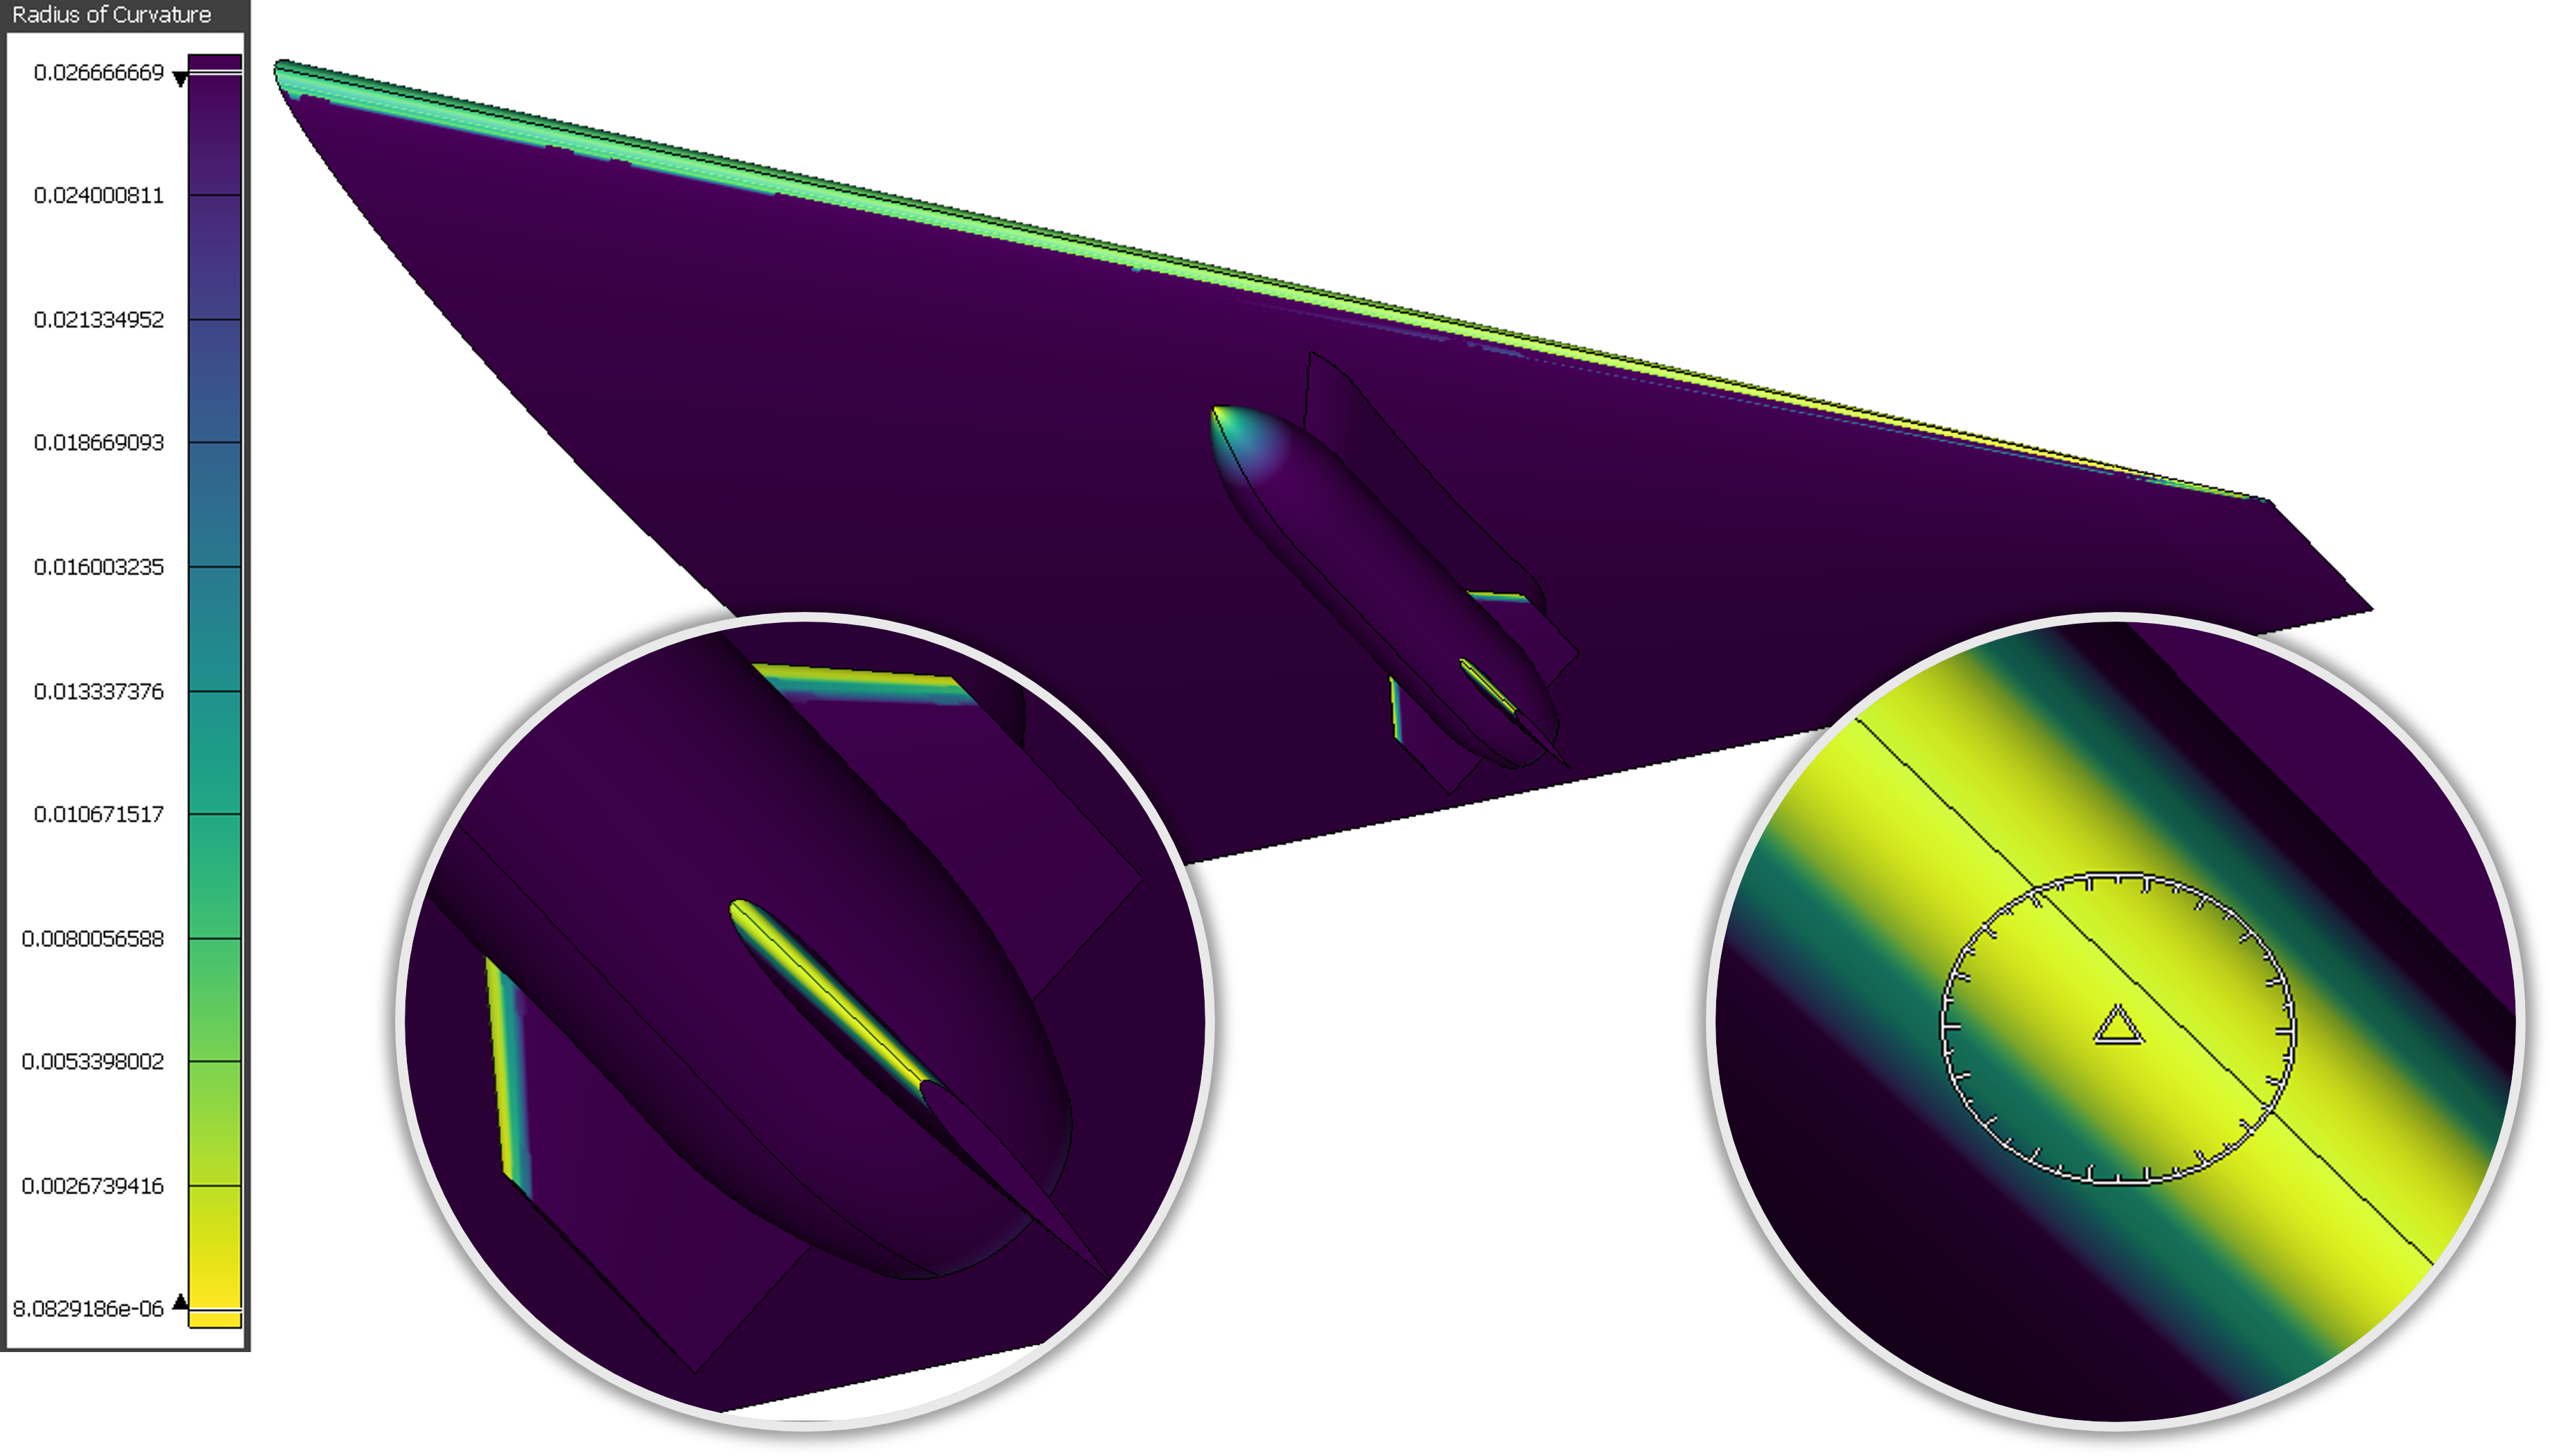
Click the Show Surface Curvature button to shade the selected database models by radius of curvature in a viridis color bar style. Note that the color bar is shown with 10 levels ranging from yellow (smallest radius of curvature) to purple (largest radius of curvature). Additionally, hovering your mouse over the selected database surfaces renders a sample surface cell encircled with the corresponding radius of curvature at the mouse point location.
Tip: Use the Show Surface Curvature command to inspect the surface curvature before running Automatic Surface Mesh. This will highlight regions with the smallest radius of curvature and help you to set appropriate values for Min. Allowed Radius of Curvature (both in the Advanced frame on the Global tab and per stretching filter on the Boundaries tab.
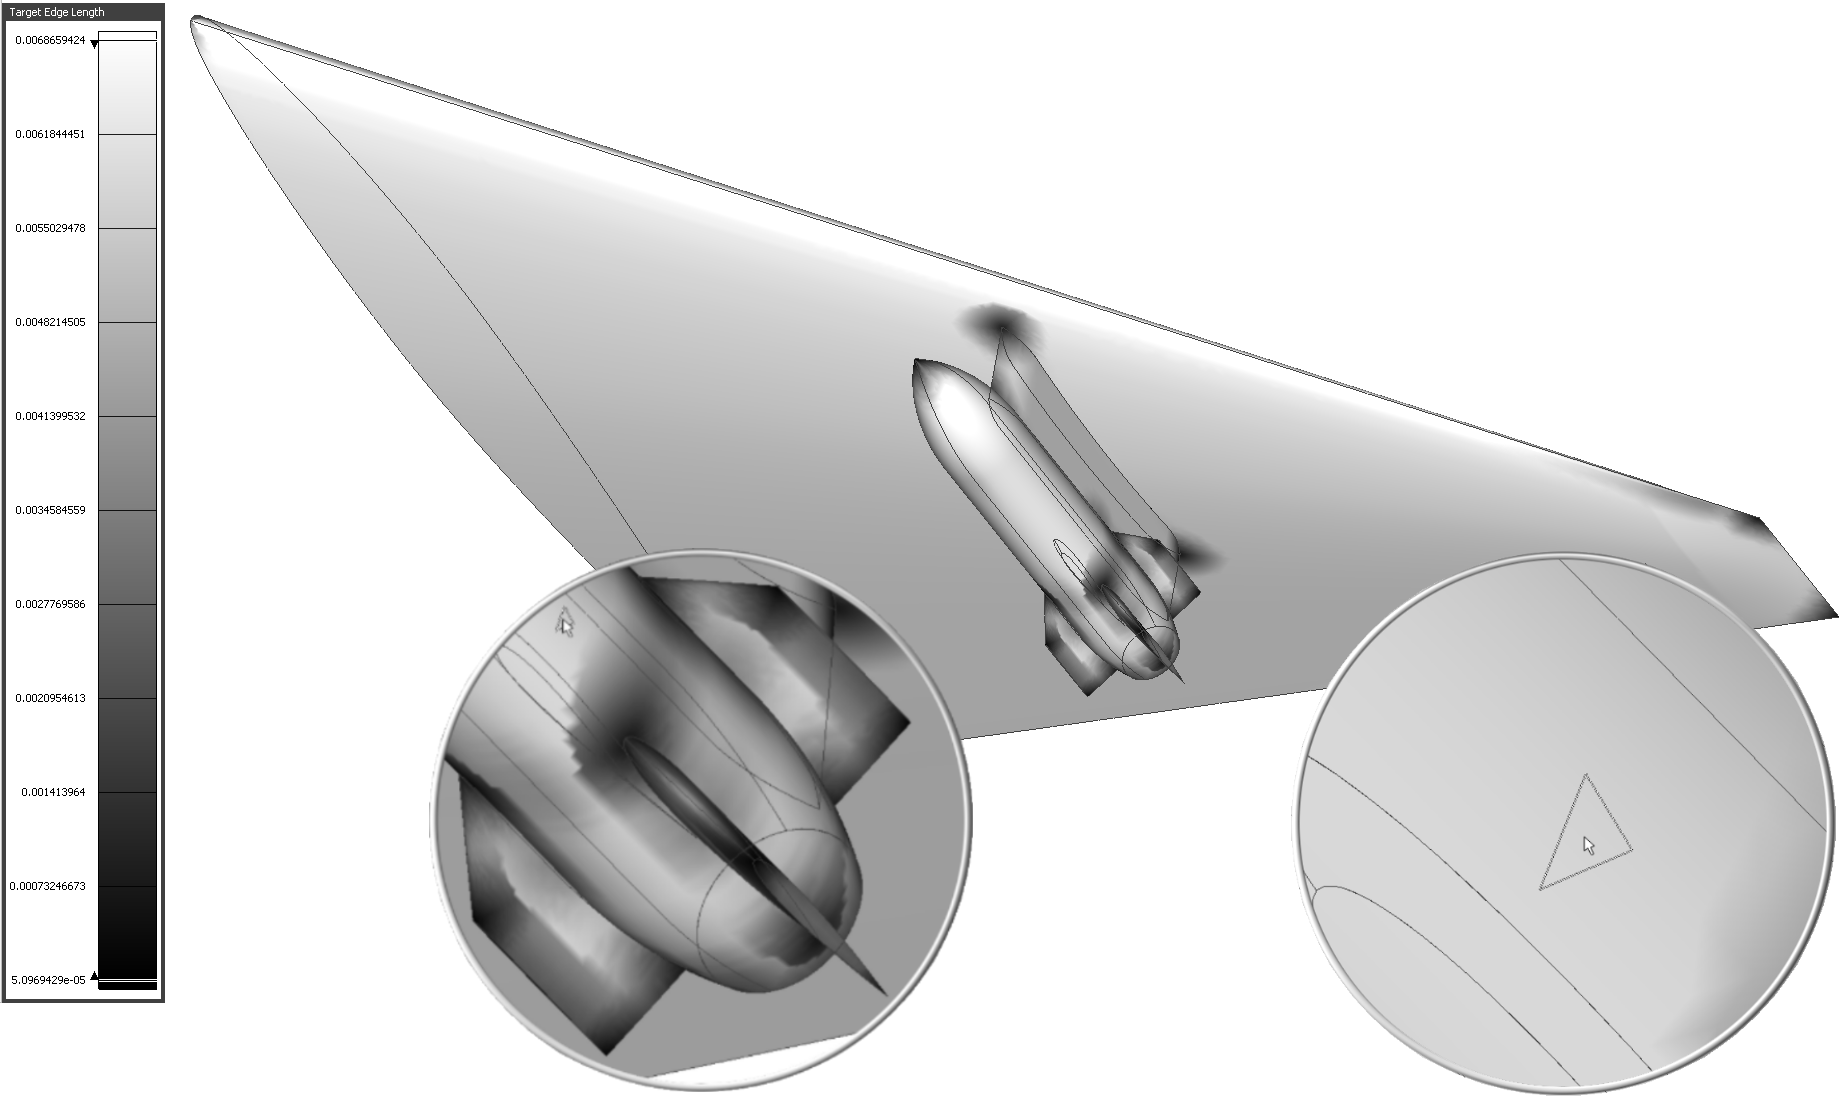
Click the Show Size Field button to shade the selected database models by the size field in a grayscale color bar style. Note that the color bar is shown with 10 levels ranging from black (smallest edge lengths) to white (largest edge lengths). Additionally, hovering your mouse over the selected database surfaces renders a sample surface cell at the mouse pointer location. The sample cell (a triangle or a quad, depending on the Algorithm selected in the Goals frame) has an edge length that is consistent with the size field at that particular location.
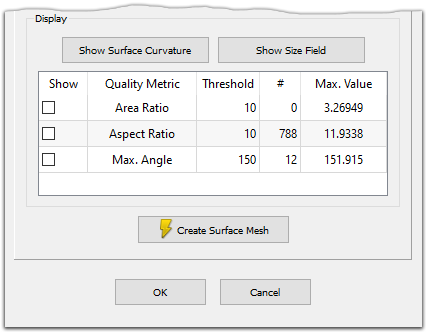
The second element in this frame is a table displaying information related to different quality metrics for the final set of unstructured domains created by the Automatic Surface Mesh functionality based on the input parameters. The table consists of five columns displaying the following information:
- Show: This column controls the visualization of the surface cells that violate the defined metric threshold (see the Threshold column below). When this option is enabled, the cells in violation are rendered in the Display window in red, with the Flat Fill type, and with its vertices rendered as points in the same color.
- Quality Metric: This column displays the quality metric being examined. Note that the fields in this column are read-only which means that the quality metrics cannot be changed nor can additional quality metrics be added to the table. This table contains the following quality metrics:
- Area Ratio: This metric has a default Threshold value of 10.0. For detailed information about this metric, review the description of the Area and Volume Ratio examine function.
- Aspect Ratio: This metric has a default Threshold value of 10.0. For detailed information about this metric, review the description of the Aspect Ratio examine function.
- Max. Angle: This metric has a default Threshold value of 150.0. For detailed information about this metric, review the description of the Maximum Included Angle examine function.
- Threshold: This column displays the threshold values for each quality metric. Note that the fields in this column are populated with default values that can be edited and replaced with user-defined values more suitable for the problem at hand. The threshold values specified in this column are used to determine which cells are in violation of the different quality metrics.
- #: This column reports the number of surface cells that are in violation of each Quality Metric according to their respective Threshold values.
- Max. Value: This column reports the maximum value computed for each Quality Metric. Additionally, you can right click your mouse on each field in this column to reveal a list with three options:
- Zoom to Location: Use this option to zoom to the surface cell with the maximum extrema value of the corresponding Quality Metric.
- Zoom and Align to Location: Use this option to zoom to the surface cell with the maximum value of the corresponding Quality Metric and align the view orientation with the normal to the cell in question.
- Set Rotation Point at Location: Use this option to set the Rotation Point at the centroid of the surface cell with the maximum extrema value for the corresponding Quality Metric.
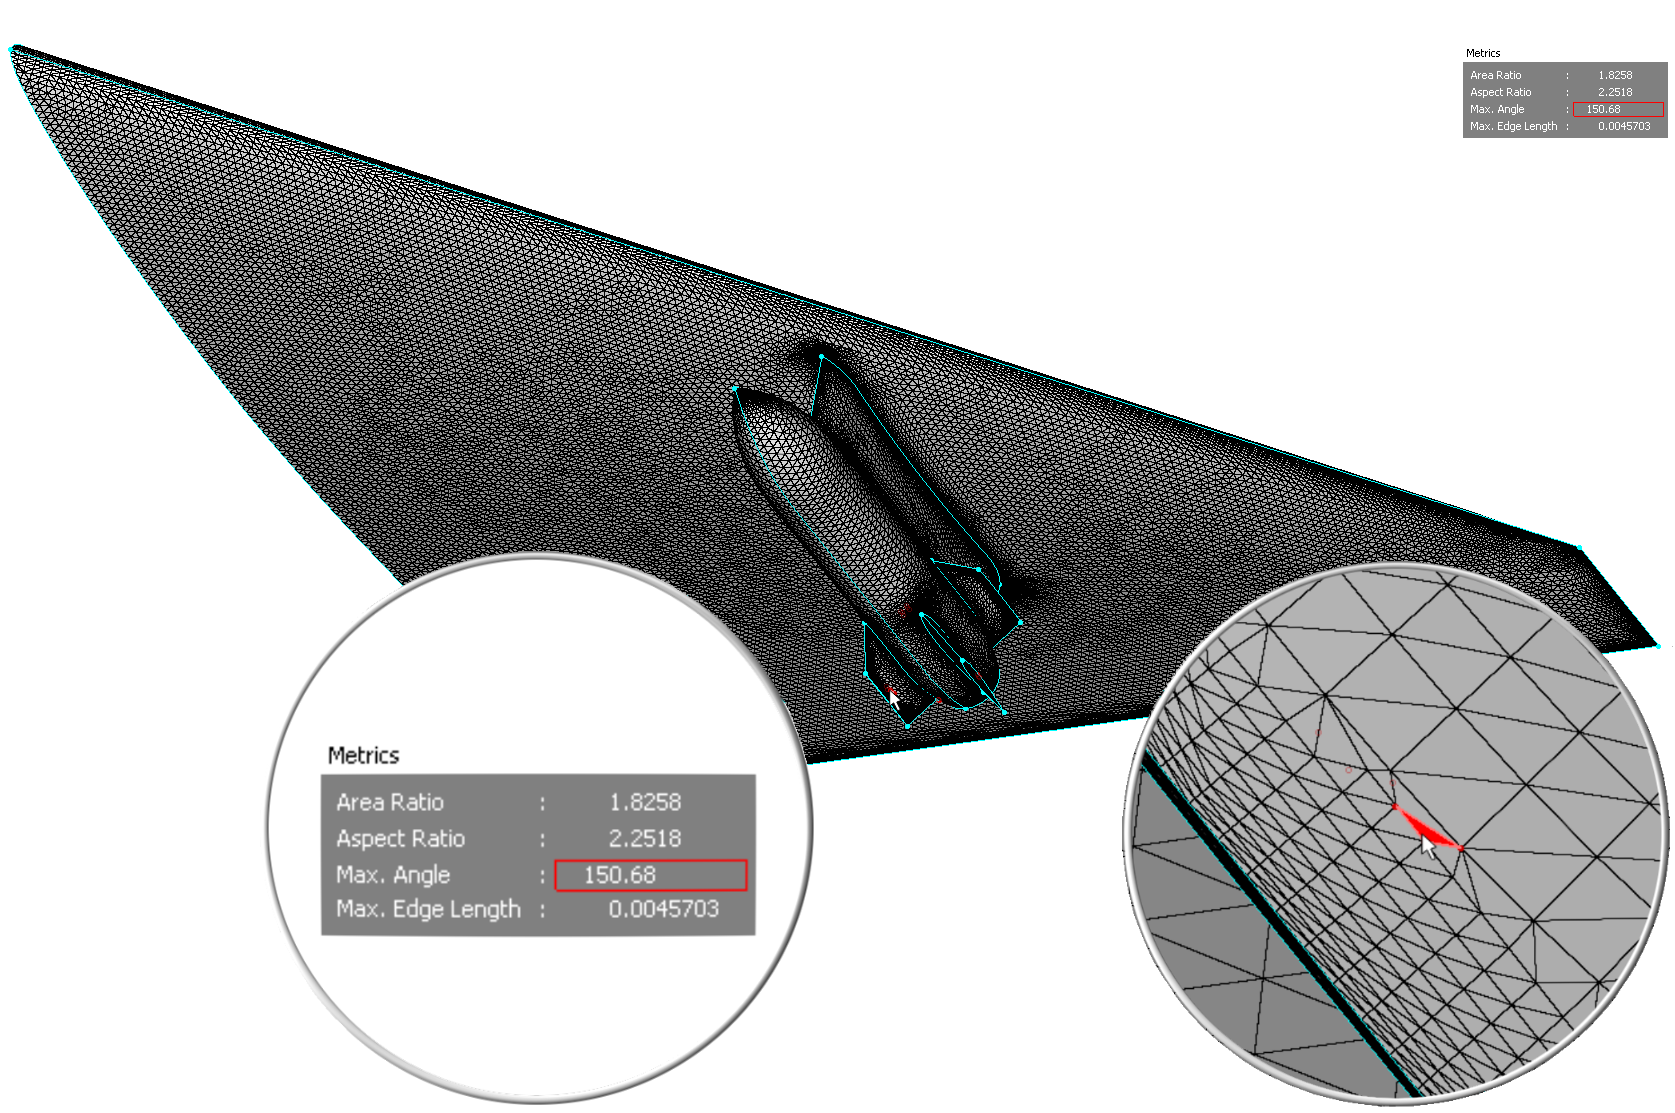
The Display window also displays a quality Metrics box which shows values for the following metrics: Area Ratio, Aspect Ratio, Max. Angle, and Max. Edge Length. Furthermore, the values shown correspond to the cell currently under the mouse pointer. Move your mouse over the surface grid and note how the values update on the fly.